Bull-bear flow: Dip-buy zone
Setup and observation guide for the Dip-buy zone pattern inside the proprietary Bull-bear flow indicator. It explains how to show only this pattern, how its blue candle bodies appear on the chart and how to record them, without reconstructing unpublished calculations.
Show this pattern on its own
- Add Bull-bear flow to the main chart as described in its guide. Open the Bull-bear flow guide
- Open the Indicators panel on the right. While Bull-bear flow is on the chart, its row expands into a grid of pattern toggles, each followed by the mark it draws.
- Clear the other toggles and keep only Dip-buy zone. This pattern is enabled by default. Toggles change visibility only; the indicator is not recalculated and the change applies immediately.
- The toggle state is stored in this browser and kept for the next session. Re-enable the other toggles to restore the full display.
Observe the displayed result
With only the Dip-buy zone toggle enabled, the pattern appears on the main price chart as blue candle bodies. Record the bar and date of each mark and compare closed bars; the author has not published a buy or sell meaning beyond the pattern name.
The Bull-bear flow ribbon and centre line are not pattern toggles. They stay visible when a single pattern is shown and serve as context on the same chart.
Actual application chart
This screenshot shows Bull-bear flow: Dip-buy zone running on the application's MSTR daily chart. Price and indicator share the same market history, preserving the curves, bars and markers drawn by the application.
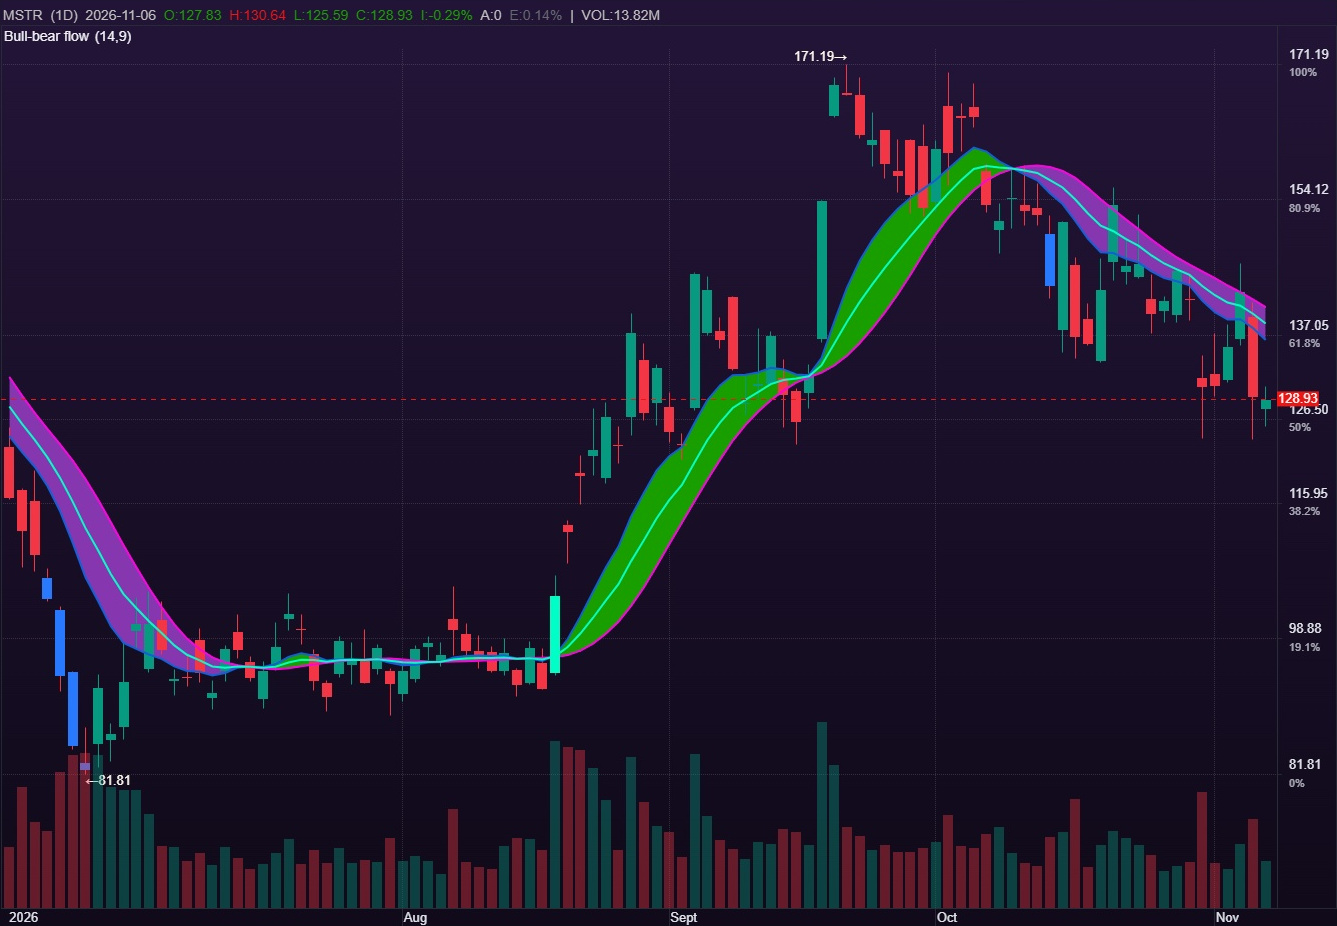
Across the 500 loaded daily bars, 39 carry this pattern’s mark. The chart is positioned around an actual mark near 2026-10-14.
With only the Dip-buy zone toggle enabled, the pattern appears on the main price chart as blue candle bodies. Record the bar and date of each mark and compare closed bars; the author has not published a buy or sell meaning beyond the pattern name.
- Check the displayed indicator name and parameters against the version currently loaded.
- Align price and indicator by time, then compare direction, turning points and marker locations.
- After changing settings or timeframe, wait for calculation to finish before saving the same interval for comparison.
The screenshot records a historical chart display, not executed orders, returns or a win rate.
Known information and usage limits
- This pattern belongs to Bull-bear flow and requires an Ultra account with access to it. Actual access follows the application’s entitlement message.
- The conditions are unpublished. This guide does not infer thresholds, periods, signal direction, repainting behaviour or performance.
- A mark on an open bar can still change. To check historical marks, save the same window at different times and compare.
- Resolve preview masking, entitlement messages or missing data first. An empty region does not mean the pattern did not occur.